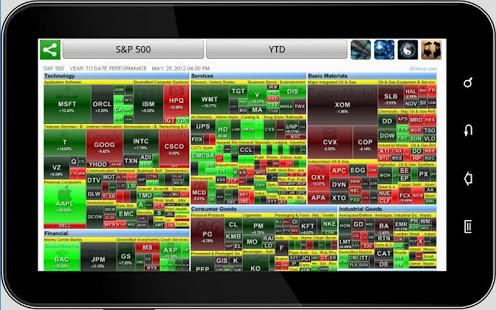
The color indicates the stock performance in percent. Based on the color you can identify losers (red), neutral (black), and gainers (green).
Select:
* S&P 500
* World
* ETF
Choose Data:
* YTD (= Year-to-date = since beginning of the year)
* 1 Day
* 1 Week
* 1 Month
* 3 Months
* 6 Months
* 1 Year
* Relative Volume
* P/E
* Forward P/E (PRO version)
* PEG ratio (PRO version)
* Price/Sales (PRO version)
* Price/Book (PRO version)
* Dividend Yield (PRO version)
* EPS Growth (last 5 years) (PRO version)
* Float Short (%) (PRO version)
* Analysts Recom. (PRO version)
* Earnings Day Perfo (PRO version)
* Earnings Day (PRO version)
=> You can then SEND YOUR HEATMAP ('Share' icon at the top left corner) directly through Twitter, email, Facebook, etc...
★★★ It is still under development, so please rate it accordingly ★★★
Please take a few seconds to SHARE the app on Twitter, Facebook, Google+ or any preferred venue as more downloads = we will spend more time to develop this app further!
Thank You.
WaveStock.com
Charts and data are coming from FINVIZ - Thank you so much Alex.
Copyright © 2010 FINVIZ.com. All Rights Reserved.
keyword: heatmapper; heatmap, stocks, stocks app, stocks widget, stocks yahoo, wallstreet, wallstreet survivor
We do not host Stock Market HeatMap on our servers. We did not scan it for viruses, adware, spyware or other type of malware. This app is hosted by Galad and passed their terms and conditions to be listed there. We recommend caution when installing it.
The APK Download link for Stock Market HeatMap is provided to you by apps112.com without any warranties, representations or guarantees of any kind, so access it at your own risk.
If you have questions regarding this particular app contact the publisher directly. For questions about the functionalities of apps112.com contact us.

|
| ||||
| Downloads: 12 | ||||
| Updated At: 2024-04-23 09:40:58 | ||||
| Publisher: Stock Droid | ||||
| Operating System: Android 2.1 And Up | ||||
| License Type: Free Trial |